Interpreting Web Analytics for Beginners

Web analytics tools are abundant, but in order to use such tools effectively, you need to decide what information you need and how to interpret it correctly. After that you then need to make the necessary changes to your web site in order to attract more visitors and improve your search engine rankings.
What information do I need?
This is a question that you should try answering before deciding on which web analytics tool to choose – going for the most advanced and most expensive one is not always the best choice. If you primarily source of traffic are the search engines, you will most certainly need information that tells you:
- Which keywords and key phrases are the visitors using to find your web site?
- Is the search engine traffic increasing, decreasing, or constant?
- Which search engine is sending you the most visitors?
- Which pages receive most of the search engine traffic?
- Where does your website rank for certain keywords?
If you want to analyze the on-site experience of your visitors, then you need to look into different data:
- What are the most popular entry and exit pages?
- What is the number of new visitors vs. the number of repeat visitors?
- How long do the visitors stay on the site?
- How many pages do they visit while on the site?
- Are the visitors bookmarking your website, posting comments, and subscribing to your newsletters?
- Are the users subscribing to your site’s RSS feeds?
If you decide to run PPC campaigns, then you would need entirely different information, which will help you analyze the success of your campaigns, tune up your ads, and ultimately achieve better return on your investment.
How do I interpret the Web analytics data?
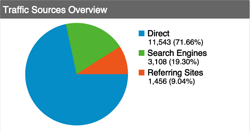
 Some number are pretty straightforward and easy to understand – if your search engine traffic has been decreasing for the past six months, then it is more than obvious that this is a trend, which you need to take into consideration. There is data that is not that easy to understand though and requires careful interpretation – if your website’s visitors spend little time on the site and visit very few pages this could indicate poor content and disinterest. However, this is a typical visitors’ behavior for most of the ‘Q&A websites’ such as answers.com or Yahoo answers and as long as the number of repeat visitors remains high, the low time on the site and the low page views do not indicate visitors’ dissatisfaction. Visitor segmentation will help you analyze the different traffic sources such as email campaigns, organic search engine traffic, and PPC and decide which one is the most profitable for you, while looking at the bounce rate will give you a good idea on how well targeted your ads are and the quality of your traffic.
If some or most of the data is hard to understand and analyze, you can hire a web analytics consultant, who can help you interpret all the figures and show you how to optimize your website.
What changes should I make?
 Once you have pinpointed the weak elements of your website, it is time for improvement – based on all the gathered and analyzed data, you need to make a plan and take some action in order to make your website even more successful and attract more visitors. Tweaking your PPC ads, improving your website navigation, adding more and higher quality content, building more back links, and putting more effort into your email campaigns are only a few steps that you could take in order to boost your website’s rankings, increase your traffic and your sales.
Web analytics are very important but can be worthless if you do not know what to do with the data that you collect. Please ask any questions you may have about web analytics in the comments.
